ResNet-50 saw the load. The dashboards learned to watch.
100 waves of traffic through all four pods. Grafana panels built from scratch. The request rate and inference latency are now visible in real time.
The monitoring stack from 010 could scrape. Today I gave it something to scrape.
The constraint
Prometheus was collecting metrics but nothing was visualizing them. The Grafana dashboards that shipped with kube-prometheus-stack show cluster-level CPU and memory. They know nothing about ResNet-50 inference latency or HTTP request rates per endpoint. I needed panels that track what this specific API actually does under load.
The proof
Starting the cluster
Minikube came up with the full stack running — all four model pods, Prometheus, Grafana, AlertManager, kube-state-metrics.
$ kubectl get pods
NAME                                                     READY   STATUS    RESTARTS       AGE
alertmanager-prometheus-kube-prometheus-alertmanager-0   2/2     Running   8 (11m ago)    3d
prometheus-grafana-58dd9c597d-frqfx                      3/3     Running   15 (11m ago)   3d
prometheus-kube-prometheus-operator-5f4f55c78b-zw25j     1/1     Running   8 (10m ago)    3d
simple-model-api-deployment-5f789d9fd8-cg5s5             1/1     Running   2 (11m ago)    2d
simple-model-api-deployment-5f789d9fd8-gbvmh             1/1     Running   2 (11m ago)    2d
simple-model-api-deployment-5f789d9fd8-h2bjw             1/1     Running   2 (11m ago)    2d
simple-model-api-deployment-5f789d9fd8-rrxvt             1/1     Running   2 (11m ago)    2d
Minikube also reported kubelet RBAC errors on startup — five pods flagged as forbidden. This is a known issue with Minikube’s node identity in newer Kubernetes versions and does not affect workload scheduling or metrics collection. Everything came up clean regardless.
Injecting load
I ran 100 waves of traffic against all three endpoints — /health, /info, and /predict — with 50ms between waves.
$ kubectl exec deploy/simple-model-api-deployment -- python -c "
import urllib.request, time
for i in range(100):
    for path in ['health', 'info', 'predict']:
        try:
            urllib.request.urlopen(f'http://localhost:8000/{path}',
                data=b'{}' if path=='predict' else None)
        except Exception:
            pass
    print(f'► Wave {i+1}/100 injected...')
    time.sleep(0.05)
"
► Wave 1/100 injected...
...
► Wave 100/100 injected...
300 requests total across the deployment. Enough to produce visible signal in Prometheus.
Building the panels
I built two panels from scratch in Grafana using raw PromQL.
Request rate by status code:
sum(rate(http_requests_total[5m])) by (endpoint, status_code)
The first run showed three status codes — 200, 404, and 422. The 404s were leftover scrape noise from before 010’s fix. The 422s were /predict calls with an empty body {} — FastAPI rejects that because the request schema requires a proper image payload. I was not sending one.
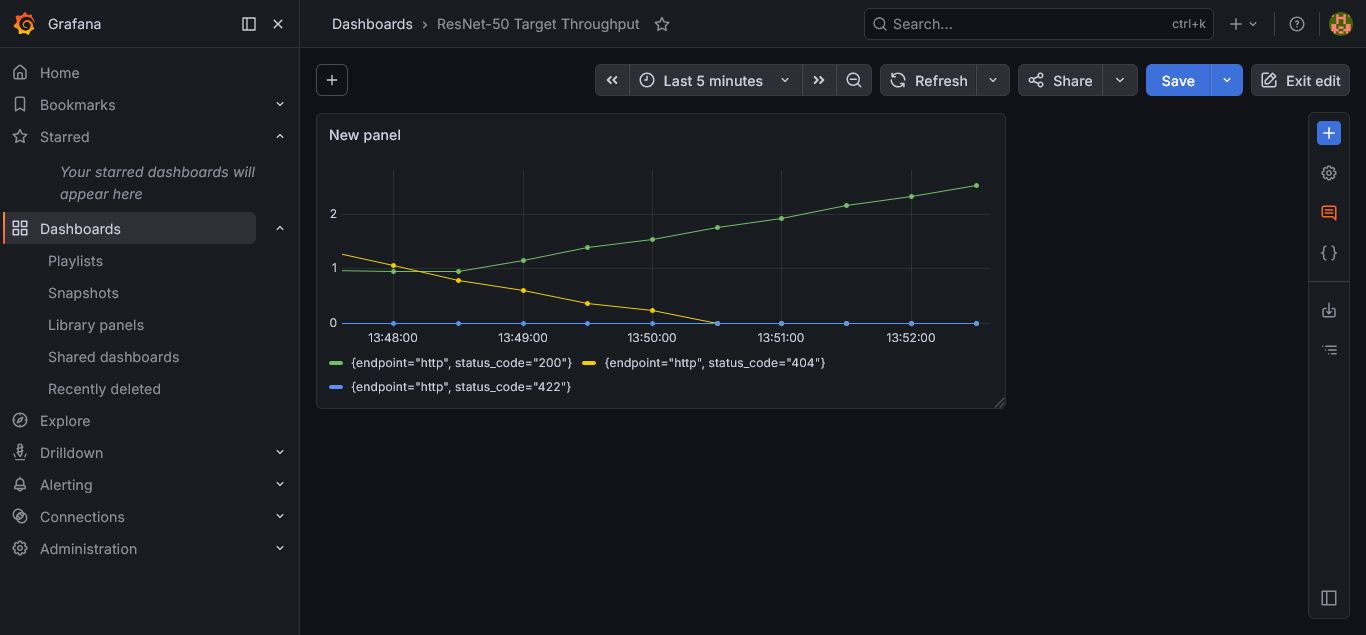
Fig 1: Request rate during load injection — 200s climbing, 404 and 422 visible.
After the 404s cleared and the injection settled, only 200s and 422s remained. The 422s held flat — consistent rejection of the malformed predict calls. The 200s tracked the actual request volume.
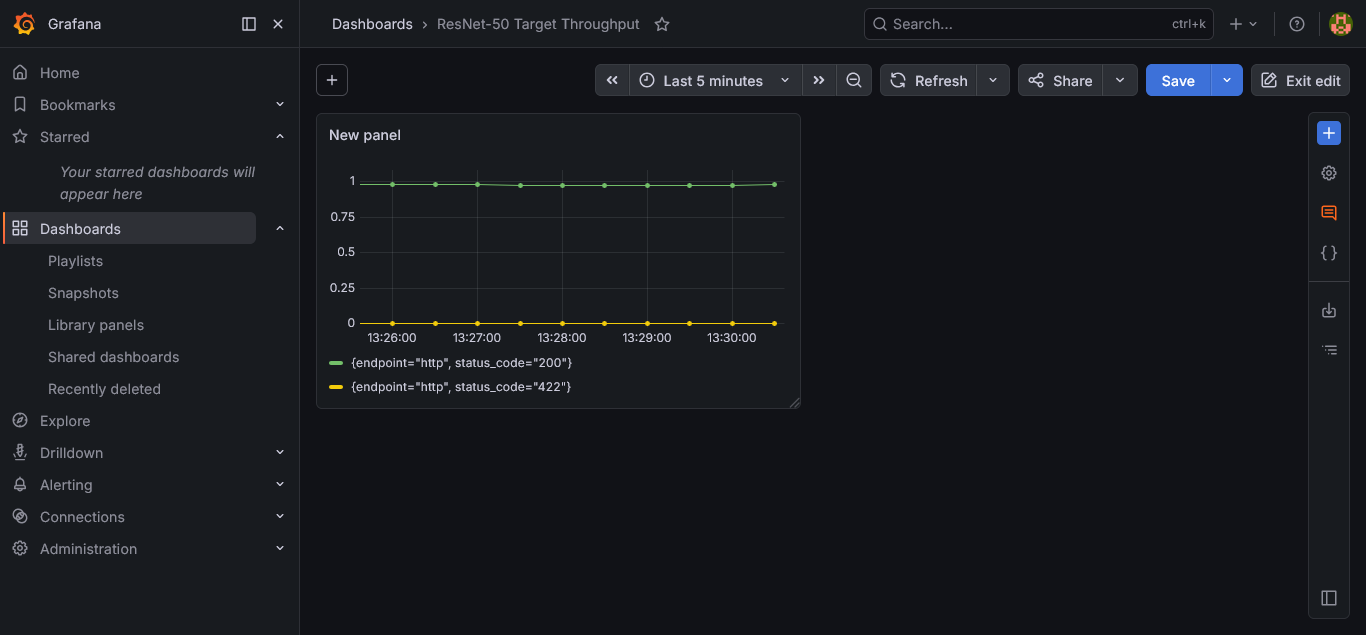
Fig 2: Request rate stabilized — 404s gone, 200s and 422s only.
Inference latency per pod:
model_inference_duration_seconds
The second panel tracked model_inference_duration_seconds across all four pods individually. The blue line — pod h2bjw — ran consistently higher than the others, peaking around 0.016 seconds. The remaining three pods clustered between 0.004 and 0.008 seconds.
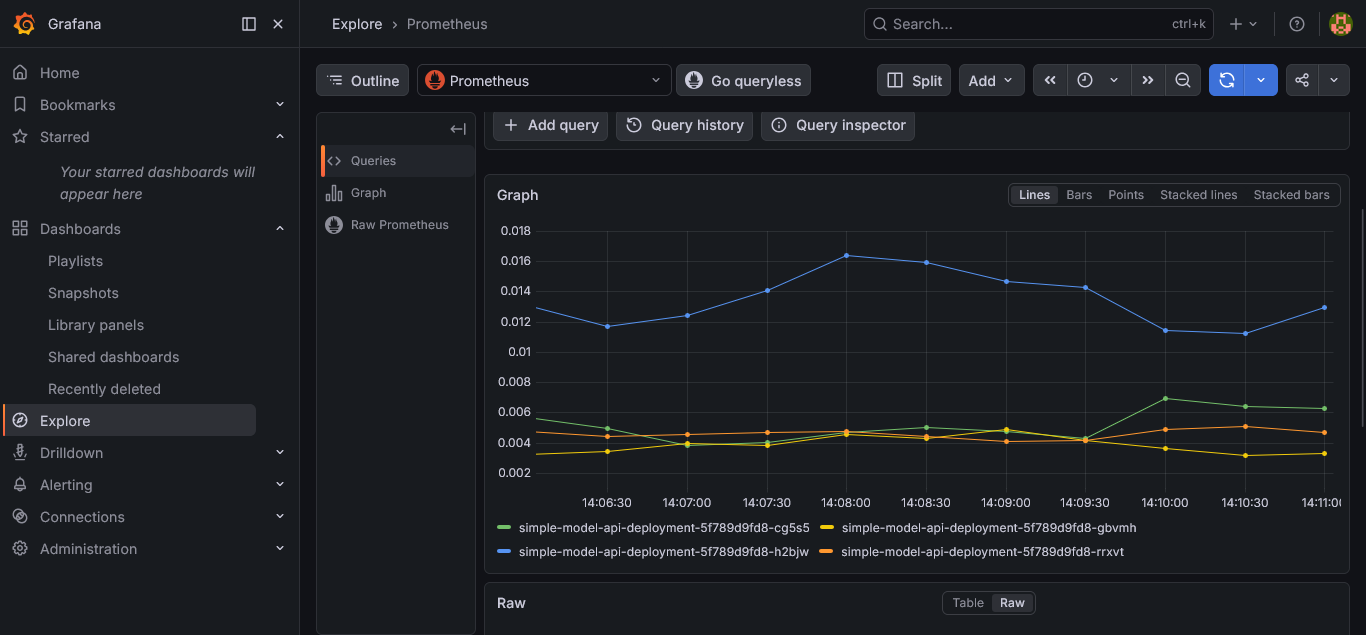
Fig 3: Per-pod inference latency. One pod consistently slower than the rest.
I do not know yet why h2bjw runs hotter. All four pods share the same image, the same resource limits, the same node. The variance is real and shows up consistently across multiple scrape windows.
The Kubernetes namespace dashboard
The built-in Kubernetes / Compute Resources / Namespace dashboard showed “No data” for CPU and memory utilization panels. The data source was set to default instead of Prometheus. Switching to Prometheus did not immediately populate the panels — the namespace selector was also wrong.
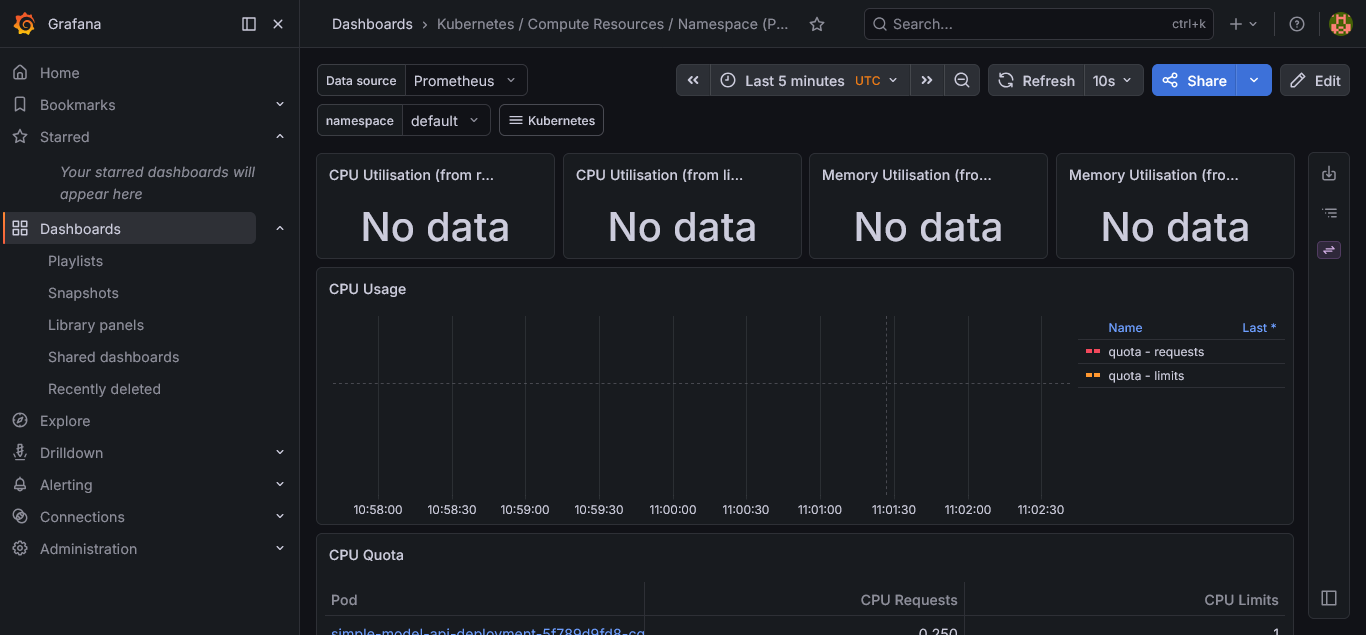
Fig 4: Kubernetes namespace dashboard — CPU and memory panels returning no data.
I did not fully resolve this. The panels that matter — request rate and inference latency — are working. The cluster resource panels are a separate problem.
The complete dashboard
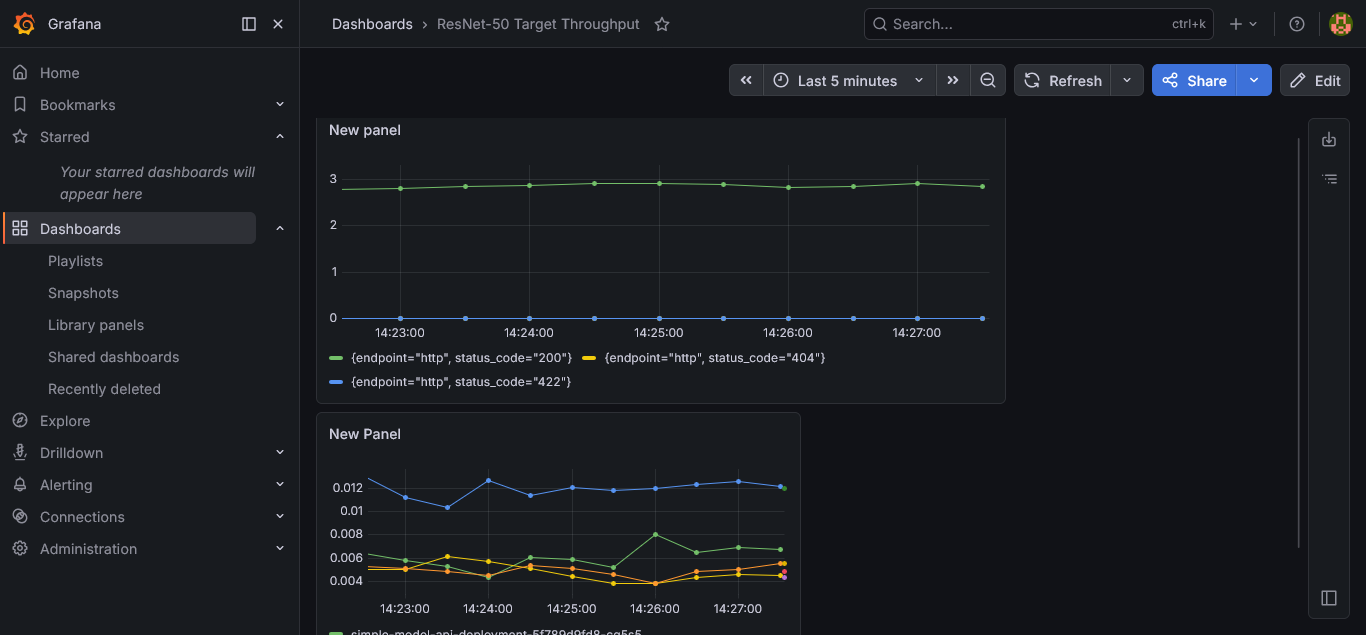
Fig 5: Dashboard with all custom panels live — request rate and inference latency side by side.
Where this sits
| Item | Status |
|---|---|
| Load injection — 100 waves | Done |
| Request rate panel (by status code) | Live |
| Inference latency panel (per pod) | Live |
422s on /predict | Expected — malformed payload |
Pod h2bjw latency variance | Open — cause unknown |
| Kubernetes namespace dashboard | Not resolved — data source mismatch |
The dashboards are watching. One pod is slower than the others and I have not found out why yet.