The quota landed. The utilisation panels still say nothing.
The slow pod from 011 came back late again — 97 seconds between gunicorn and application startup. Resource limits hit the namespace. Grafana's utilisation panels are still blank, and now I know exactly why.
011 ended with one pod running hotter than the others and no explanation. Today it happened again.
The constraint
Two things carried over from 011. First: pod h2bjw was consistently slower than the other three across multiple scrape windows, and I had no cause. Second: Grafana’s CPU and memory utilisation panels were returning “No data” — I knew the data source was misconfigured but fixing it did not populate the panels.
Today I watched h2bjw start slow for a second session in a row, enforced resource quotas on the namespace, and traced the “No data” problem to its actual root.
The proof
h2bjw — slow again
The cluster came up with all model pods at 0/1 Running. Standard. Within a few minutes they moved to 1/1. But I pulled the logs on h2bjw specifically:
$ kubectl logs simple-model-api-deployment-5f789d9fd8-h2bjw --tail=50
[2026-06-13 06:10:04 +0000] [1] [INFO] Starting gunicorn 22.0.0
[2026-06-13 06:10:04 +0000] [1] [INFO] Listening at: http://0.0.0.0:8000 (1)
[2026-06-13 06:10:04 +0000] [1] [INFO] Using worker: uvicorn.workers.UvicornWorker
[2026-06-13 06:10:04 +0000] [8] [INFO] Booting worker with pid: 8
[2026-06-13 06:11:41 +0000] [8] [INFO] Started server process [8]
[2026-06-13 06:11:41 +0000] [8] [INFO] Waiting for application startup.
Gunicorn started at 06:10:04. The server process did not begin until 06:11:41. 97 seconds between the worker booting and application startup — on a pod that shares the same image, the same resource limits, and the same node as the other three.
I checked the container state directly:
$ kubectl get pod simple-model-api-deployment-5f789d9fd8-h2bjw \
    -o jsonpath='{.status.containerStatuses[0].state}'
{"running":{"startedAt":"2026-06-13T06:09:44Z"}}
Running. Just late. This is the second session where h2bjw logs show it lagging behind the others during startup. In 011 it ran consistently hotter at inference time. The pattern is no longer a coincidence — something specific to this pod’s state is affecting it. I do not know what yet.
The quota landed
I set hard resource limits on the default namespace:
$ kubectl create quota minikube-quota \
    --hard=requests.cpu=4,requests.memory=8Gi,limits.cpu=4,limits.memory=8Gi \
    --namespace=default
resourcequota/minikube-quota created
Grafana picked it up immediately. First I caught it filling in mid-window — the quota ceiling appearing partway through the chart as the scrape registered:
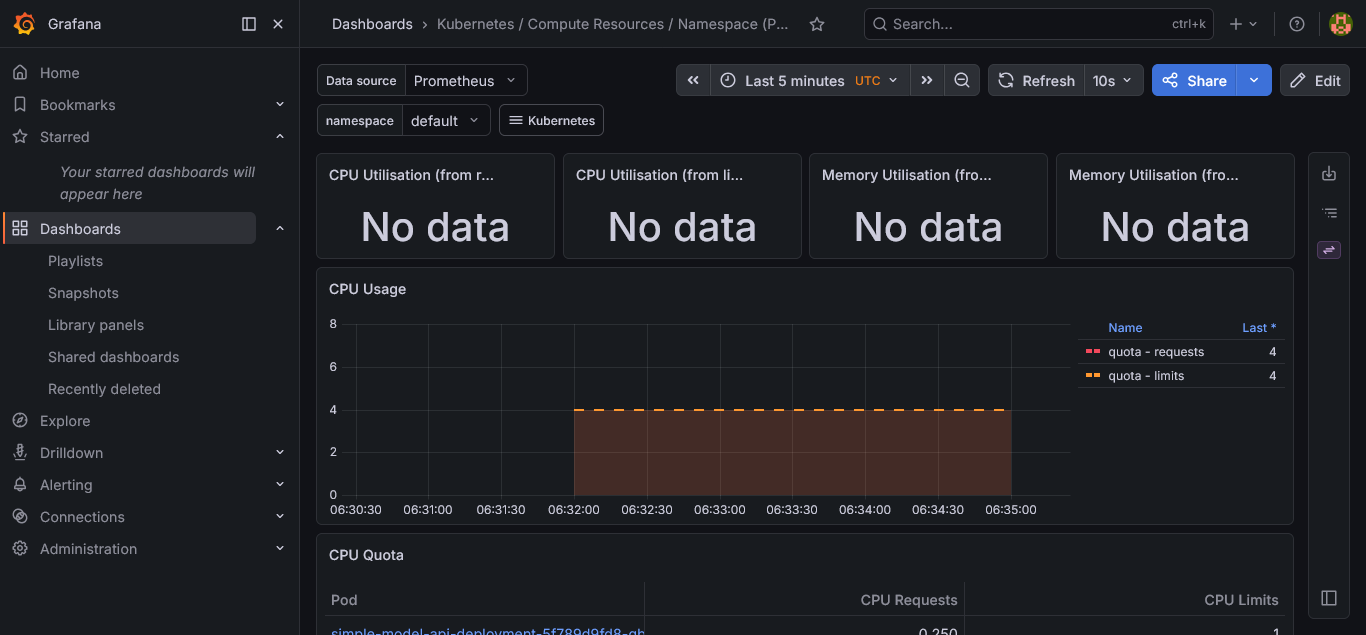
Fig 1: CPU ceiling filling in from 06:32 onward.
A few minutes later the ceiling held flat across the full window:
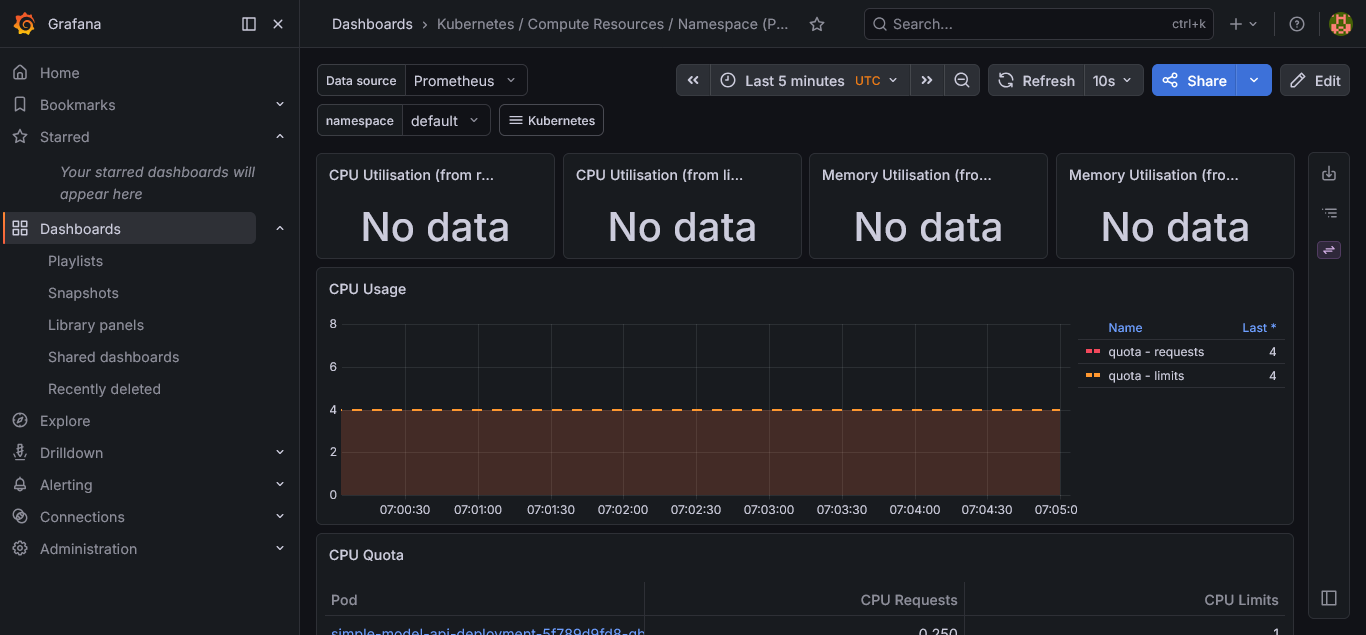
Fig 2: CPU ceiling fully filled, time window 07:00–07:05.
The CPU Quota table listed all five active pods at 0.250 CPU requests and 1 limit each. Below it, the Memory Usage chart showed the 8 GiB ceiling:
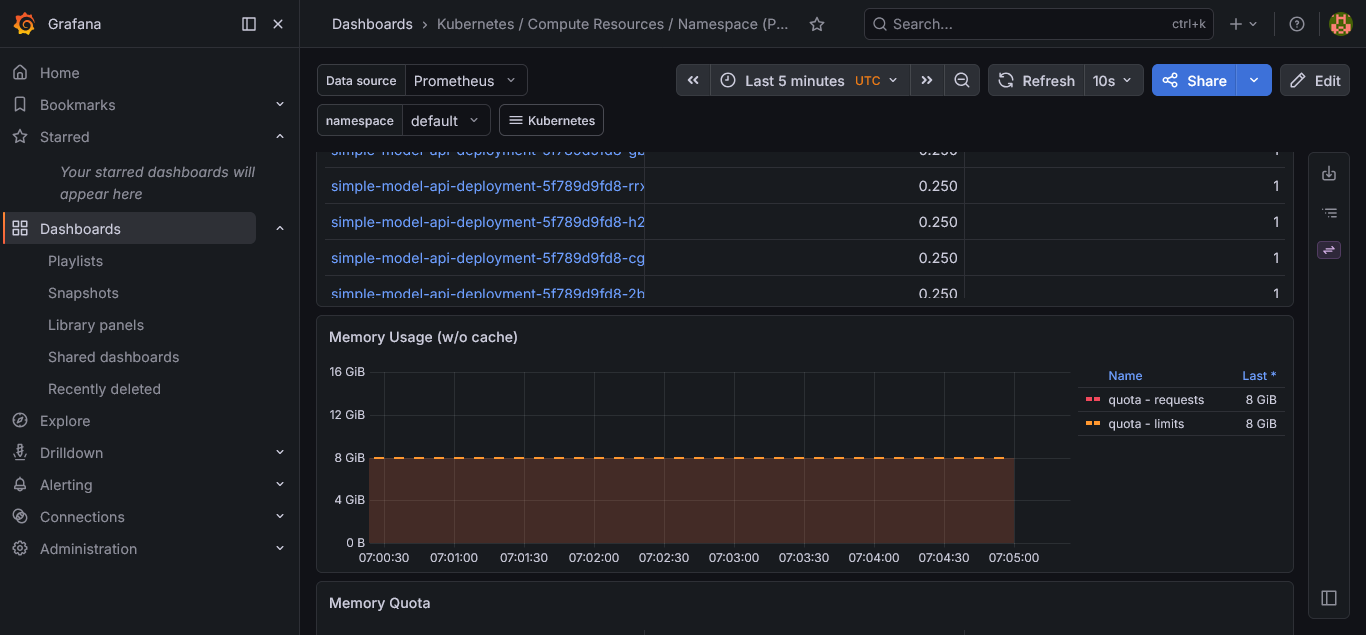
Fig 3: Pod quota table and 8 GiB memory ceiling.
The utilisation panels — still blank
The four panels at the top of the dashboard — CPU Utilisation from requests, CPU Utilisation from limits, Memory Utilisation from requests, Memory Utilisation from limits — held at “No data” across every time window. I expanded to 1 hour. Nothing changed:
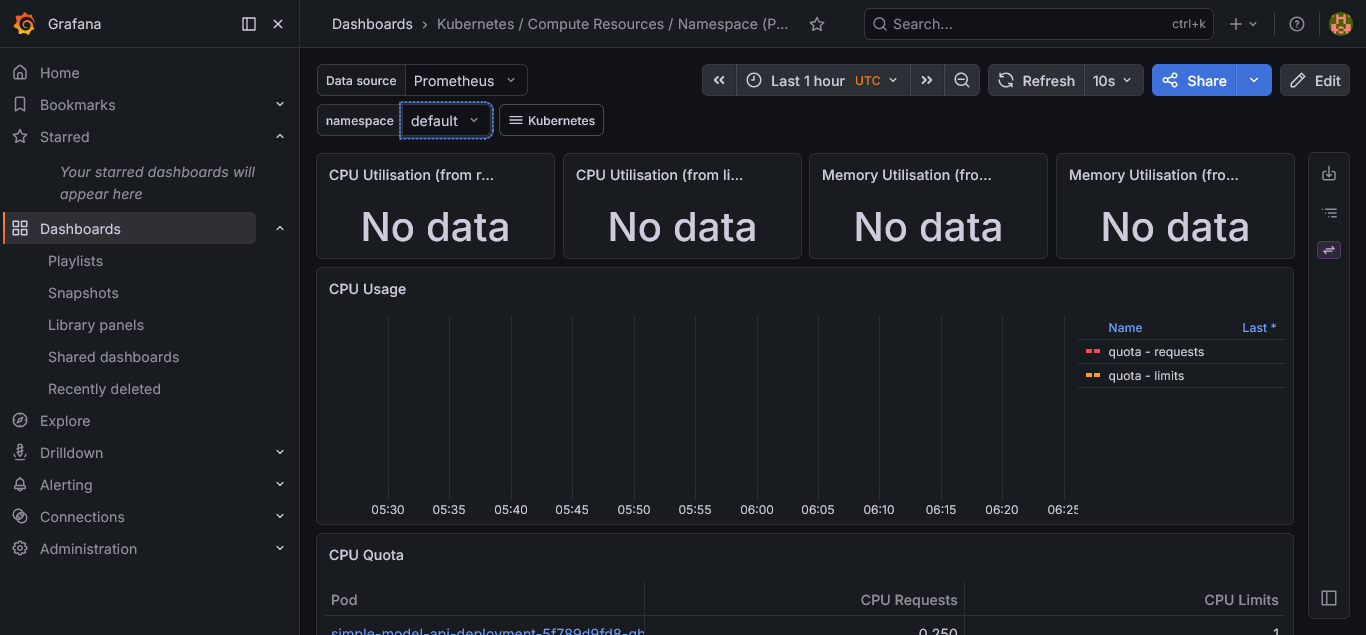
Fig 4: “No data” across all four utilisation panels, 1-hour window.
What Prometheus can and cannot reach
Prometheus scrapes two separate things from the cluster:
- The Kubernetes API server — configuration data, resource quotas, pod specs. This works. The quota panels prove it.
- The Kubelet’s cAdvisor endpoint — real-time hardware consumption, actual CPU cores used, actual memory bytes allocated. This does not work.
Minikube provisions its nodes with self-signed TLS certificates. Prometheus validates certificates by default. It sends a request to the Kubelet, receives a certificate no trusted authority signed, and drops the connection. The metrics — container_cpu_usage_seconds_total, container_memory_working_set_bytes — never arrive.
The data exists. kubectl top reaches it through the metrics-server via a different path:
$ kubectl top pods
NAME                                                   CPU(cores)   MEMORY(bytes)
simple-model-api-deployment-5f789d9fd8-cg5s5           240m         258Mi
simple-model-api-deployment-5f789d9fd8-gbvmh           238m         259Mi
simple-model-api-deployment-5f789d9fd8-h2bjw           231m         260Mi
simple-model-api-deployment-5f789d9fd8-rrxvt           234m         228Mi
Each pod consuming around 235m CPU and 255–260 MiB memory. Prometheus has none of this. The utilisation panels query metrics cAdvisor provides. Prometheus cannot reach cAdvisor. The panels return nothing.
The fix is a single change to the Helm chart values: set insecureSkipVerify: true on the Kubelet scrape job. Prometheus stops validating the self-signed certificates and starts receiving the cAdvisor data stream. No application code changes. No redeployment.
Where this sits
| Item | Status |
|---|---|
| Namespace resource quota enforced | Done |
| Grafana quota panels — CPU and memory ceilings | Live |
| Grafana utilisation panels — actual consumption | Still blank |
| Root cause of “No data” | Prometheus TLS blocking cAdvisor scrape |
| Fix identified | insecureSkipVerify: true in Helm values |
Pod h2bjw slow startup — second session | Open — cause still unknown |
Pod h2bjw inference latency variance from 011 | Open — not yet diagnosed |
Two sessions. Same pod. Two open questions. The utilisation fix is a one-liner away — h2bjw is going to take longer.