The 404 was a ghost. The image was stale.
Prometheus scraped /metrics and got 404. The route existed in main.py on disk. It did not exist inside the running container. The pods were serving an image that predated all the monitoring code.
The constraint
Transmission 009 ended with two open problems: the Docker build hanging inside Minikube’s daemon, and a missing /metrics endpoint. I fixed both today. Then a third problem appeared that took longer to find than the first two combined.
Prometheus reported every single scrape target as DOWN. Six endpoints, six 404s. The /metrics route was right there in main.py. I could read it. It just was not running.
The proof
Fixing the build
The build hung yesterday because pip was downloading PyTorch (~280 MB) through Minikube’s Docker-in-Docker network stack. The VM’s internal daemon routes all traffic through a NAT bridge. Pip stalled every time.
I built the image on the host Docker daemon instead, then loaded it into Minikube.
$ minikube start --cpus=4 --memory=8192
😄  minikube v1.38.1 on Microsoft Windows 11 Pro 22H2
✨  Using the docker driver based on existing profile
🏄  Done! kubectl is now configured to use "minikube" cluster

$ unset DOCKER_TLS_VERIFY DOCKER_HOST DOCKER_CERT_PATH DOCKER_MINIKUBE_ACTIVE

$ docker build -t simple-model-api:latest .
[+] Building 1467.9s (16/16) FINISHED
 => [builder 4/5] RUN python -m venv /opt/venv && pip install ...  786.5s
 => [runtime 4/6] RUN python -c "import torchvision; ..."         151.6s
 => exporting to image                                            305.4s

$ minikube image load simple-model-api:latest
The host build finished in 24 minutes. The same step inside Minikube’s daemon ran for over an hour twice yesterday before I killed it.
Wiring the monitoring stack
The Prometheus Operator, Grafana, and kube-state-metrics were already running from yesterday’s Helm install.
$ kubectl get pods -A | grep -E "prometheus|grafana"
prometheus-grafana-58dd9c597d-frqfx                 3/3  Running
prometheus-kube-prometheus-operator-5f4f55c78b-zw25j 1/1  Running
prometheus-prometheus-kube-prometheus-prometheus-0    2/2  Running
prometheus-prometheus-node-exporter-tvvlq             1/1  Running
I applied the Service (now ClusterIP with a named http port), the ServiceMonitor, and the HPA.
$ kubectl apply -f kubernetes/service.yaml
service/simple-model-api-service configured

$ kubectl apply -f kubernetes/servicemonitor.yaml
servicemonitor.monitoring.coreos.com/simple-model-api-monitor unchanged
I verified the Prometheus Operator was selecting the right label.
$ kubectl get prometheus -o jsonpath="{.items[*].spec.serviceMonitorSelector.matchLabels}"
{"release":"prometheus"}
The ServiceMonitor carries release: prometheus. The selector matched.
The 404
I port-forwarded Prometheus and checked the target health page. Every endpoint was DOWN.
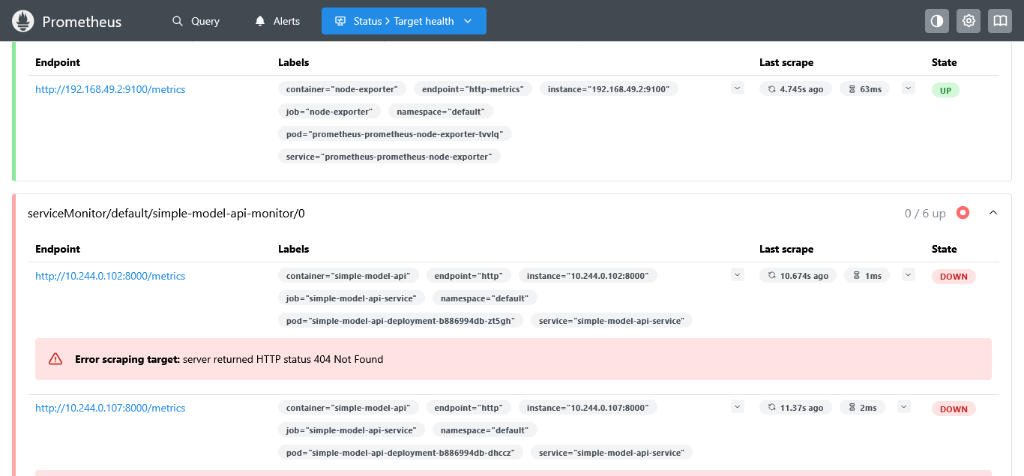
Fig 1: 0 / 6 up. Every scrape target returning 404 Not Found.
serviceMonitor/default/simple-model-api-monitor/0    0 / 6 up

http://10.244.0.102:8000/metrics  DOWN  "HTTP status 404 Not Found"
http://10.244.0.107:8000/metrics  DOWN  "HTTP status 404 Not Found"
The /metrics route exists in main.py. I wrote it. It uses prometheus_client.generate_latest() and returns the Prometheus text format. The code was correct.
@app.get("/metrics", tags=["operations"])
async def metrics() -> Response:
    return Response(content=generate_latest(), media_type=CONTENT_TYPE_LATEST)
I queried the OpenAPI schema from inside a running pod.
$ kubectl exec deployment/simple-model-api-deployment -- python -c \
    "import urllib.request, json; \
     r=urllib.request.urlopen('http://localhost:8000/openapi.json'); \
     data=json.loads(r.read()); \
     print('\n'.join(data['paths'].keys()))"

/health
/info
/predict
No /metrics. The route did not exist inside the container. The running image was built before I added the monitoring code. The pods were serving stale code. The /metrics endpoint, the PrometheusMiddleware, the INFERENCE_LATENCY histogram, the REQUEST_COUNT counter — none of it was in the container.
The 404 was not a routing bug. It was a deployment bug. The image was old.
The fix
I also found a second issue in deployment.yaml. The ServiceMonitor references the scrape port by name:
# servicemonitor.yaml
endpoints:
  - port: http
But the Deployment’s container port had no name:
# deployment.yaml (before)
ports:
  - containerPort: 8000
    protocol: TCP
The Prometheus Operator could not resolve http to a target port. I added the name.
# deployment.yaml (after)
ports:
  - name: http
    containerPort: 8000
    protocol: TCP
I rebuilt the image inside Minikube, applied the updated Deployment, and rolled the pods.
$ minikube image build -t simple-model-api:latest -f Dockerfile .
#15 writing image sha256:65f97a25... done
#15 naming to docker.io/library/simple-model-api:latest done

$ kubectl apply -f kubernetes/deployment.yaml
deployment.apps/simple-model-api-deployment configured

$ kubectl rollout restart deployment/simple-model-api-deployment
deployment.apps/simple-model-api-deployment restarted

$ kubectl rollout status deployment/simple-model-api-deployment --timeout=300s
deployment "simple-model-api-deployment" successfully rolled out
All four pods came up clean.
NAME                                           READY   STATUS    RESTARTS   AGE
simple-model-api-deployment-5f789d9fd8-cg5s5   1/1     Running   0          5m
simple-model-api-deployment-5f789d9fd8-gbvmh   1/1     Running   0          4m
simple-model-api-deployment-5f789d9fd8-h2bjw   1/1     Running   0          2m
simple-model-api-deployment-5f789d9fd8-rrxvt   1/1     Running   0          59s
I verified the metrics endpoint from inside a pod.
$ kubectl exec deployment/simple-model-api-deployment -- python -c \
    "import urllib.request; \
     r=urllib.request.urlopen('http://localhost:8000/metrics'); \
     print('STATUS:', r.status)"

STATUS: 200
Both custom metrics registered correctly.
# HELP model_inference_duration_seconds End-to-end latency of the ResNet-50 inference pipeline
# TYPE model_inference_duration_seconds histogram
model_inference_duration_seconds_bucket{le="0.01"} 0.0
...
model_inference_duration_seconds_count 0.0

# HELP http_requests_total Total HTTP requests handled by the application.
# TYPE http_requests_total counter
http_requests_total{endpoint="/health",method="GET",status_code="200"} 73.0
Grafana
I port-forwarded Grafana and logged in with the auto-generated admin password.
$ kubectl get secret prometheus-grafana -o jsonpath="{.data.admin-password}" | base64 --decode
6IYBhLioGMH0DSXOWYd3HnMChPUJthpoH3vmwUkv

$ kubectl port-forward svc/prometheus-grafana 3000:80
Forwarding from 127.0.0.1:3000 -> 3000
The built-in Kubernetes dashboards showed all four pods with their resource budgets.
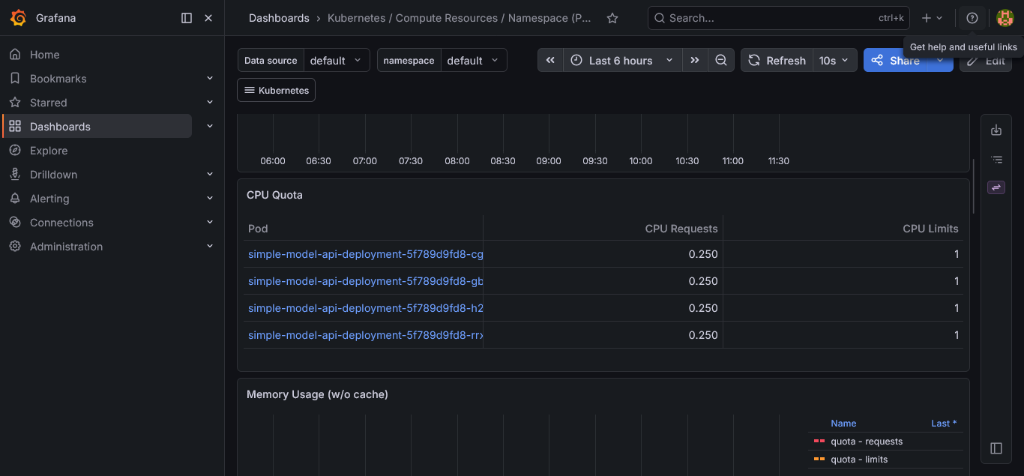
Fig 2: Grafana showing CPU quota across all four pods.
The metrics pipeline is live end to end.
Where this sits
| Problem from 009 | Status |
|---|---|
| Docker build hanging in Minikube | Fixed — build on host, load into VM |
/metrics endpoint missing | Fixed — was in code, not in image |
| Prometheus targets DOWN (404) | Fixed — stale image + unnamed port |
| Grafana dashboards | Live |
The monitoring stack scrapes clean. The pods report their own health now.