The pipeline is proven. The dashboard still has blank panels.
100 requests confirmed the API is stable. Prometheus Explore proved cAdvisor is scraping. The CPU Usage panel was fixed by removing a cluster label filter that Minikube never populates. The top stat cards and memory graphs are still blank — same fix, not yet applied.
The “No data” panels have been open since 012. Four transmissions of marking them “needs verification next session.” Today I closed the pipeline question. The dashboard cosmetics are a different problem.
The constraint
The Kubernetes / Compute Resources / Namespace dashboard had two categories of panels. Some worked — the CPU Quota table, the Memory Quota table. Some returned “No data” — the CPU Utilisation cards, the Memory Usage graph, the network panels. The assumption since 012 was that the cAdvisor TLS fix in 014 would resolve it. It did not.
The proof
The cluster came up with kube-state-metrics still crashing
$ kubectl get pods
prometheus-kube-state-metrics-6cc7c56db5-6vdrv   0/1   CrashLoopBackOff   27 (32s ago)   4d5h
prometheus-grafana-7dc9bbf8cf-lsw9t              2/3   Running            5 (3m20s ago)  4d4h
simple-model-api-deployment-6ff5fb88cb-mnw5h     0/1   Running            1 (3m20s ago)  4d3h
simple-model-api-deployment-6ff5fb88cb-sb2f6     0/1   Running            1 (3m20s ago)  4d5h
kube-state-metrics at 27 restarts and CrashLoopBackOff again. Both model pods at 0/1. I waited. Four minutes later:
$ kubectl get pods
prometheus-kube-state-metrics-6cc7c56db5-6vdrv   1/1   Running   28 (116s ago)   4d5h
prometheus-grafana-7dc9bbf8cf-lsw9t              3/3   Running   5 (4m44s ago)   4d4h
simple-model-api-deployment-6ff5fb88cb-mnw5h     0/1   Running   1 (4m44s ago)   4d3h
simple-model-api-deployment-6ff5fb88cb-sb2f6     0/1   Running   1 (4m44s ago)   4d5h
kube-state-metrics recovered on its own at restart 28. Grafana came up to 3/3. The model pods are still not ready — the startup probe is running.
100 requests. Zero failures.
I exposed the API through minikube and ran a load loop:
$ minikube service simple-model-api-service --url
http://127.0.0.1:64540

$ for i in {1..100}; do
  curl -s http://127.0.0.1:64540/health
  echo " - Request $i sent"
  sleep 0.1
done
{"success":true,"status":"healthy","model":"ResNet-50","version":"1.0.0"} - Request 1 sent
{"success":true,"status":"healthy","model":"ResNet-50","version":"1.0.0"} - Request 2 sent
...
{"success":true,"status":"healthy","model":"ResNet-50","version":"1.0.0"} - Request 100 sent
100 requests. 100 healthy responses. No errors, no timeouts.
Prometheus Explore confirmed cAdvisor is scraping
Before touching the dashboard I went to Prometheus Explore to verify the raw data existed. I queried container_memory_working_set_bytes directly:
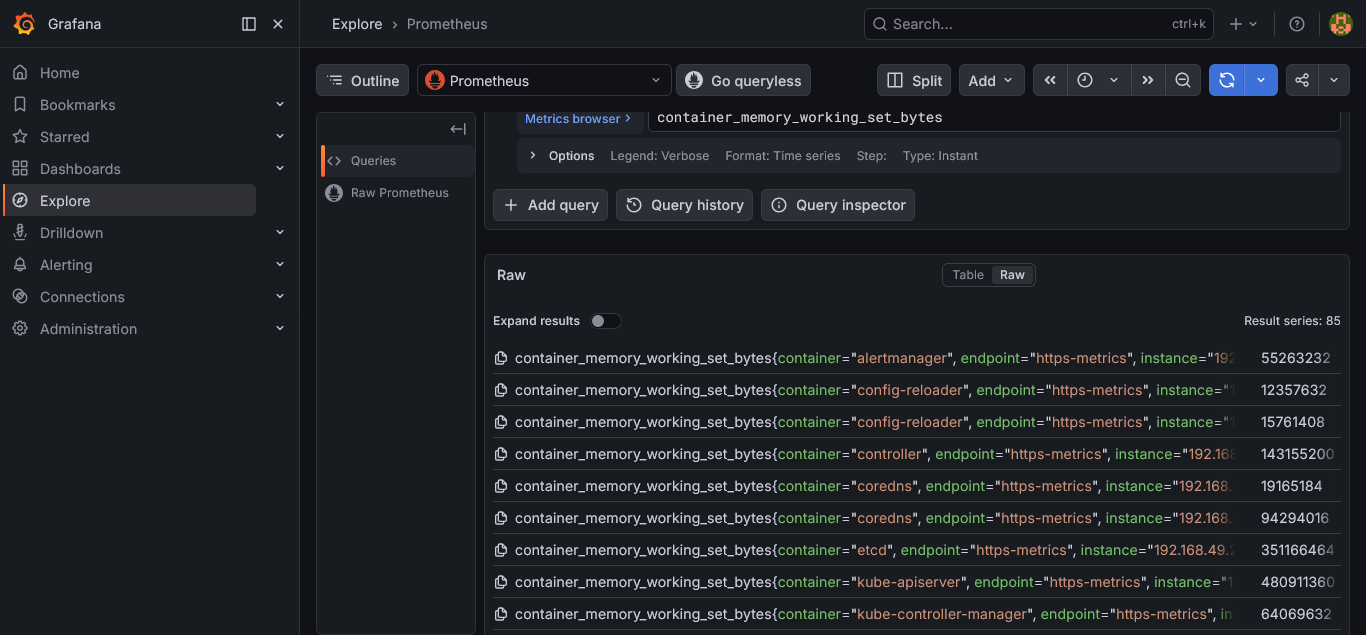
Fig 1: 85 result series returned. cAdvisor is scraping. The data exists.
Then I queried CPU per pod during the load test:
sum(rate(container_cpu_usage_seconds_total{container="simple-model-api"}[2m])) by (pod)
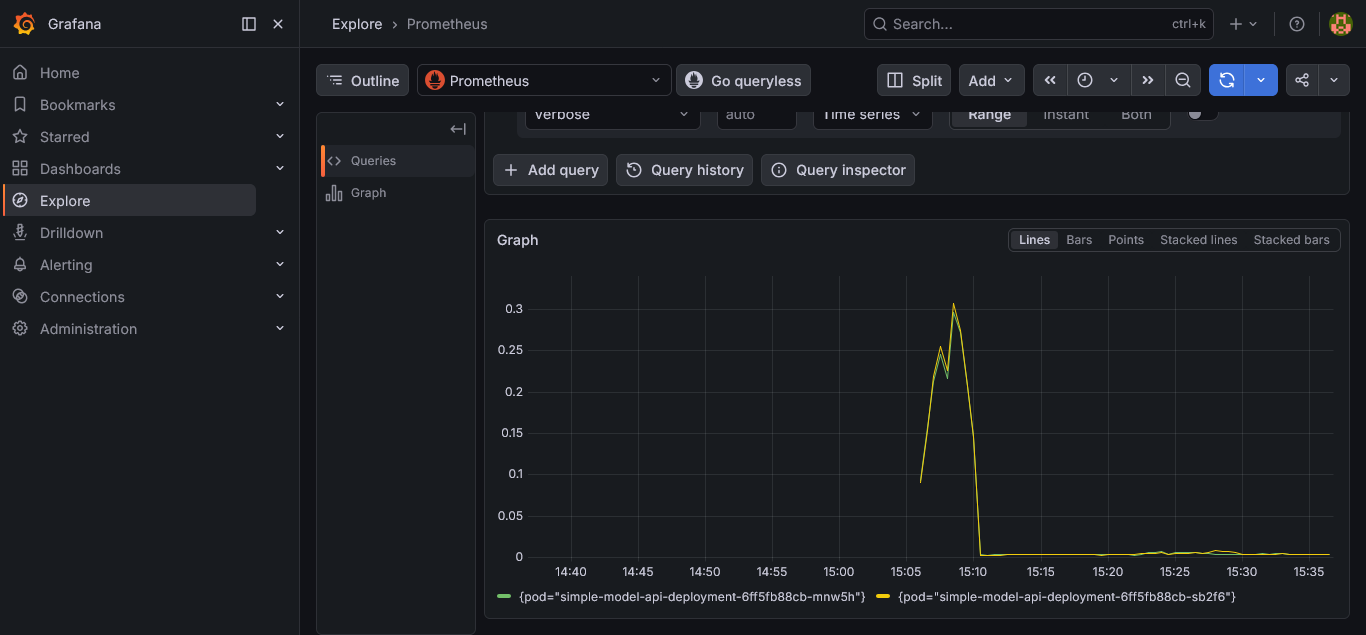
Fig 2: Both pods tracked during the 100-request load injection. mnw5h and sb2f6 split the traffic.
After the load settled, inference latency per pod:
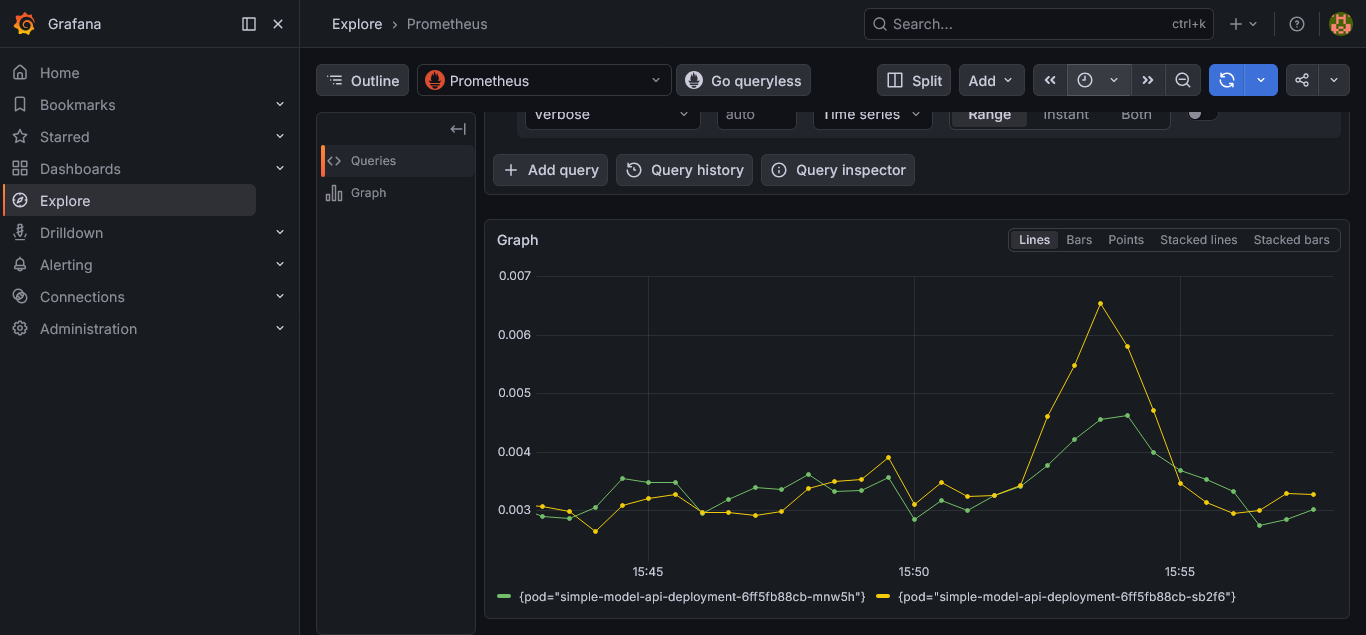
Fig 3: Both pods between 0.003 and 0.007 seconds. No single pod running significantly hotter than the other.
The pipeline is not broken. The data is flowing from cAdvisor to Prometheus to Grafana. The “No data” panels are a query problem, not a scraping problem.
The cluster dashboard showed real numbers
The Kubernetes / Compute Resources / Cluster dashboard loaded with actual utilisation:
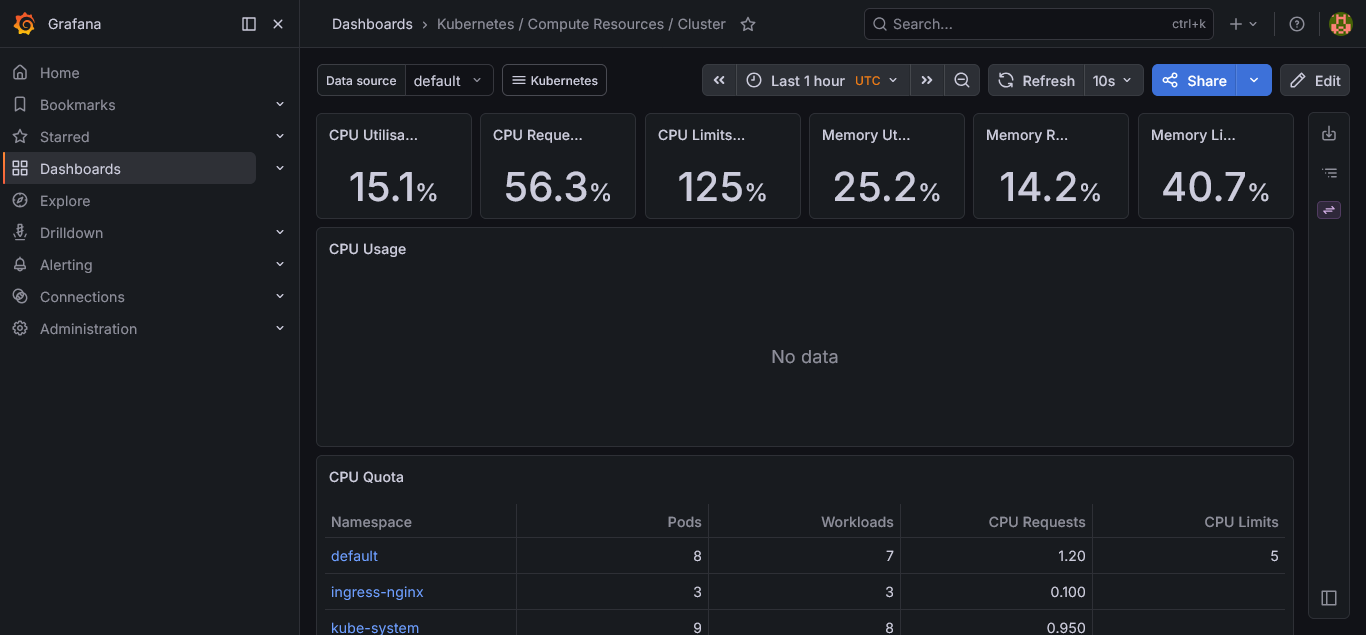
Fig 4: CPU Utilisation 15.1%, CPU Requests 56.3%, Memory Utilisation 25.2%. The cluster-level dashboard works. The namespace-level panels do not.
That confirmed the issue was specific to the namespace dashboard panels, not the data pipeline.
The CPU Usage panel — before and after
The namespace dashboard still showed “No data” on the top stat panels and the CPU Usage graph:
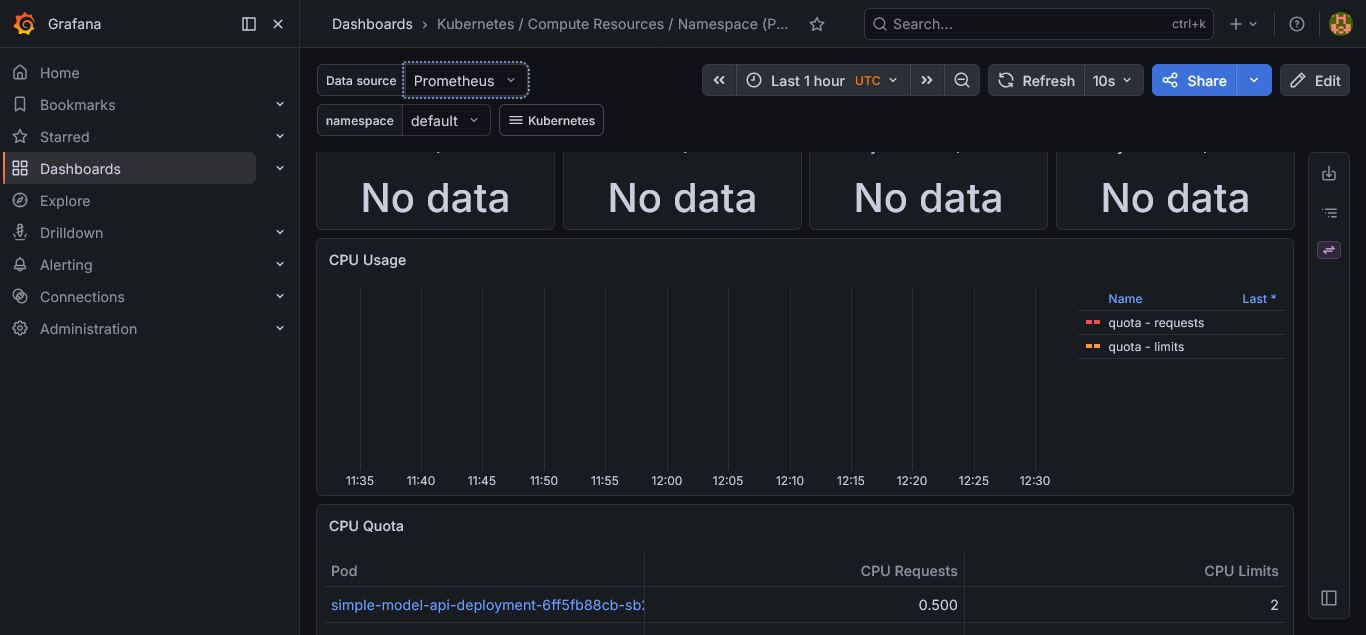
Fig 5: “No data” on all four utilisation panels. CPU Usage graph empty. This has been the state since 012.
I opened the CPU Usage panel editor. The query was:
sum(rate(container_cpu_usage_seconds_total{namespace="$namespace"}[2m]))
The panel was returning no data because the dashboard template adds a cluster="$cluster" variable filter to these queries. Minikube is a single-node local cluster — it never sets a cluster label. Every panel searching for that label returns nothing.
I removed the cluster="$cluster" filter from the CPU Usage panel query. The panel came back immediately:
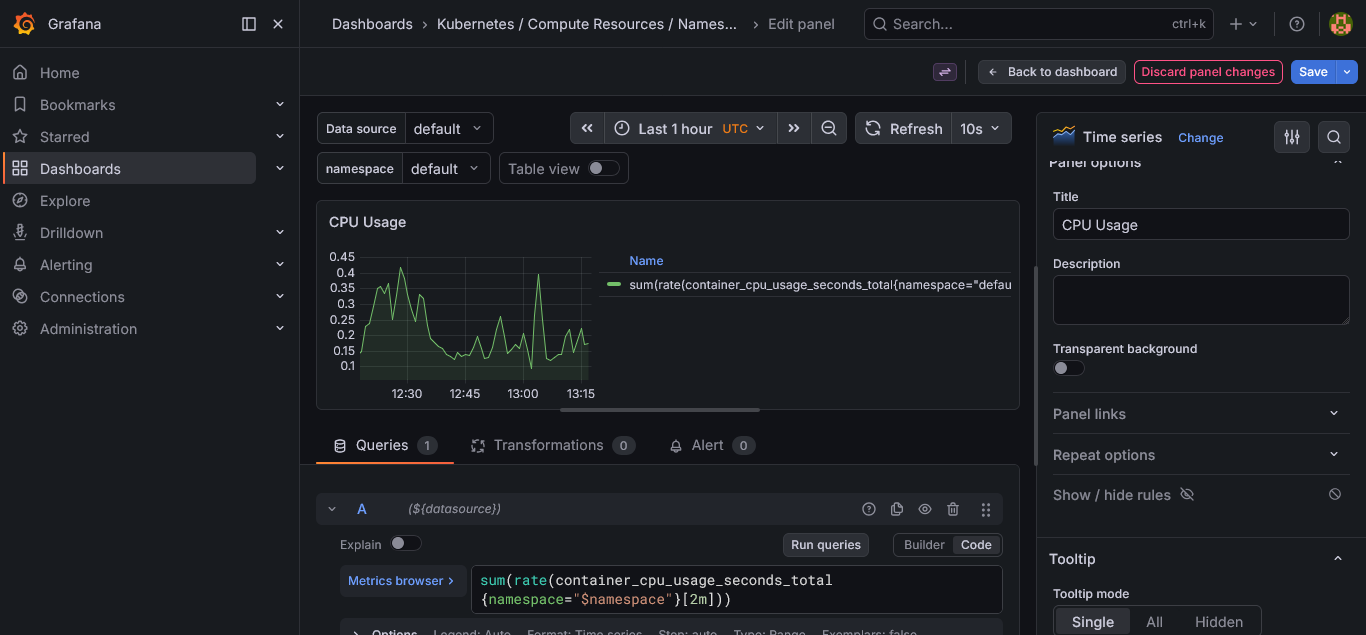
Fig 6: CPU Usage plotting live after removing the cluster label filter. The query now matches what Minikube actually produces.
The CPU Quota table confirmed both pods at the right resource allocations:
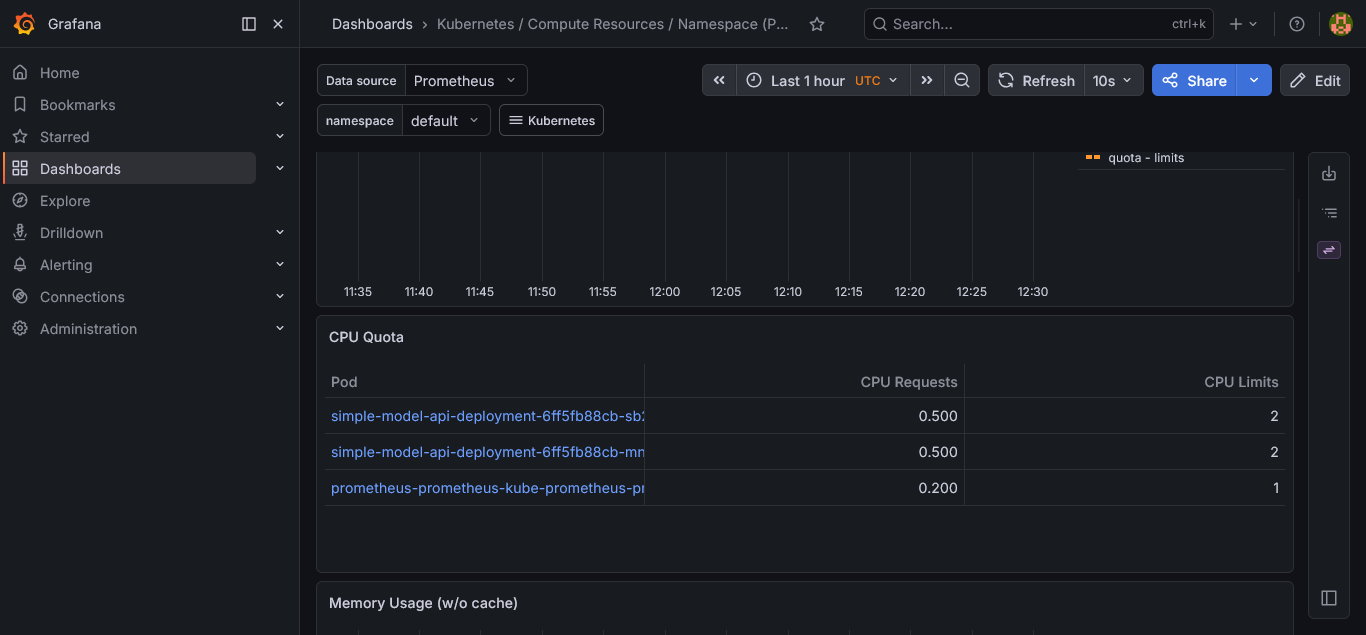
Fig 7: Both pods showing 0.500 CPU requests and 2 CPU limits. Prometheus tracking correctly.
What is still blank
The top four stat cards — CPU Utilisation, CPU Requests Commitment, CPU Limits Commitment, Memory Utilisation — and the Memory Usage graph are still returning “No data.” Their queries carry the same cluster="$cluster" filter. The fix is identical to what fixed the CPU Usage panel. I stopped here.
Where this sits
| Item | Status |
|---|---|
| 100-request load test — zero failures | Done |
| cAdvisor scraping confirmed via Prometheus Explore | Done |
| CPU per pod tracked during load injection | Done |
| Cluster dashboard — real utilisation numbers | Live |
| CPU Usage panel — cluster filter removed, plotting live | Fixed |
| CPU Quota table — both pods tracked | Live |
| Top stat cards — cluster filter still present | Open |
| Memory Usage graph — cluster filter still present | Open |
| h2bjw startup lag — no recurrence in new pods | No recurrence in new ReplicaSet |
The metrics were always flowing. The panels were searching for a label that Minikube never sets. One panel fixed, the rest need the same edit.