The quota I set in 012 blocked the rollout I ran today.
Fixed the cAdvisor TLS gap, bumped CPU limits for the 97-second startup problem, and hit three consecutive Helm errors before the upgrade landed. Then the namespace quota from 012 blocked every new pod. Deleted the quota. The rollout completed in 23 seconds. The pipeline is verified.
012 left two things open: the Grafana utilisation panels showing “No data”, and pod h2bjw running slower than the other three. Today I fixed the first. The second is still open.
The constraint
Two changes needed to land. First: patch the Helm values so Prometheus bypasses Minikube’s self-signed TLS and starts scraping cAdvisor. Second: raise the CPU request from 250m to 500m so the ResNet-50 tensor load stops getting throttled by the CFS scheduler during the 97-second startup window.
The proof
The cluster came up with the model pods still not ready
$ kubectl get pods -A
NAME                                                     READY   STATUS
simple-model-api-deployment-5f789d9fd8-2b6l9             0/1     Running
simple-model-api-deployment-5f789d9fd8-cg5s5             0/1     Running
simple-model-api-deployment-5f789d9fd8-h2bjw             0/1     Running
simple-model-api-deployment-5f789d9fd8-k79x6             0/1     Running
simple-model-api-deployment-5f789d9fd8-rrxvt             0/1     Running
simple-model-api-deployment-5f789d9fd8-vdzx7             0/1     Running
All six model pods at 0/1. Same pattern as 012. The startup probe was still working against the old resource limits.
The Helm upgrade hit three errors before it landed
I created kubernetes/values.yaml with the cAdvisor TLS fix and ran the upgrade targeting a new monitoring namespace:
$ helm upgrade --install prometheus prometheus-community/kube-prometheus-stack \
  -f kubernetes/values.yaml \
  --namespace monitoring --create-namespace
Error: kubernetes cluster unreachable: invalid configuration: unable to read
client-cert C:\Users\hp\.minikube\profiles\minikube\client.crt: Access is denied.
Windows file permission on the minikube cert. Ran it again:
Error: failed to install CRD crds/crd-alertmanagerconfigs.yaml:
unable to read client-cert ... Access is denied.
Same error, different stage. Ran it a third time and hit a different wall:
Error: unable to continue with install: ClusterRole "prometheus-grafana-clusterrole"
in namespace "" exists and cannot be imported into the current release:
annotation validation error: key "meta.helm.sh/release-namespace" must equal
"monitoring": current value is "default"
The existing Prometheus install lives in default. Moving it to monitoring would create a namespace conflict on the ClusterRole. I dropped back to default:
$ helm upgrade --install prometheus prometheus-community/kube-prometheus-stack \
  -f kubernetes/values.yaml \
  --namespace default
Error: UPGRADE FAILED: pre-upgrade hooks failed: resource
Job/default/prometheus-kube-prometheus-admission-create not ready.
Job in progress. context deadline exceeded
An admission webhook job was still running from a previous attempt. Deleted it:
$ kubectl delete job prometheus-kube-prometheus-admission-create -n default
job.batch "prometheus-kube-prometheus-admission-create" deleted
Then ran with --no-hooks to skip the webhook entirely:
$ helm upgrade --install prometheus prometheus-community/kube-prometheus-stack \
  -f kubernetes/values.yaml \
  --namespace default \
  --no-hooks
Release "prometheus" has been upgraded. Happy Helming!
REVISION: 4
STATUS: deployed
Four attempts. The values that landed:
| Setting | Value | Why |
|---|---|---|
kubelet.serviceMonitor.scheme | http | Bypasses TLS entirely |
kubelet.serviceMonitor.tlsConfig.insecureSkipVerify | true | Fallback for any TLS redirects |
kubelet.serviceMonitor.cAdvisorHttps | false | Forces cAdvisor scrape to HTTP |
prometheus.prometheusSpec.serviceMonitorSelectorNilUsesHelmValues | false | Discovers ServiceMonitors from all namespaces |
The deployment apply worked. The rollout did not.
$ kubectl apply -f kubernetes/deployment.yaml
deployment.apps/simple-model-api-deployment configured

$ kubectl rollout status deployment/simple-model-api-deployment
Waiting for deployment "simple-model-api-deployment" rollout to finish:
0 out of 3 new replicas have been updated...
error: deployment exceeded its progress deadline
I looked at the new ReplicaSet:
$ kubectl describe rs simple-model-api-deployment-6ff5fb88cb
Warning  FailedCreate  replicaset-controller  Error creating: pods
"simple-model-api-deployment-6ff5fb88cb-ptzbz" is forbidden: exceeded quota:
minikube-quota, requested: limits.cpu=2, used: limits.cpu=3, limited: limits.cpu=4
The minikube-quota I created in 012 was still enforced. The new deployment sets limits.cpu=2 per pod. Three pods need 6 cores total. The quota cap is 4. Every new pod was rejected before it started. The old pods were holding 3 cores combined, leaving only 1 free — not enough for a single new pod at 2.
The quota that was supposed to protect the cluster was now blocking the fix for the pod that was slow.
$ kubectl delete resourcequota minikube-quota -n default
resourcequota "minikube-quota" deleted
The rollout started immediately:
simple-model-api-deployment-6ff5fb88cb-lqtn8   0/1   ContainerCreating   0s
simple-model-api-deployment-6ff5fb88cb-lqtn8   0/1   Running             8s
simple-model-api-deployment-6ff5fb88cb-lqtn8   1/1   Running             23s
23 seconds from ContainerCreating to 1/1 Running. All three new pods came up at the same speed. No pod lagged behind the others.
The startup probe confirmed the new timing:
$ kubectl describe deployment simple-model-api-deployment | grep -i "Startup:"
Startup: http-get http://:http/health delay=5s timeout=5s period=10s #success=1 #failure=18
180-second window. The pods cleared it in 23 seconds. The CPU bump from 250m to 500m removed the CFS throttling during tensor load.
The predict endpoint returned live inference results
$ curl -X POST "http://127.0.0.1:8000/predict" \
  -H "accept: application/json" \
  -H "Content-Type: multipart/form-data" \
  -F "file=@test_image.jpg"

{
  "success": true,
  "predictions": [
    {"rank": 1, "class_index": 490, "class_name": "chain mail", "confidence": 0.070772},
    {"rank": 2, "class_index": 903, "class_name": "wig",         "confidence": 0.035625},
    {"rank": 3, "class_index": 643, "class_name": "mask",        "confidence": 0.031815},
    {"rank": 4, "class_index": 488, "class_name": "chain",       "confidence": 0.026007},
    {"rank": 5, "class_index": 219, "class_name": "cocker spaniel", "confidence": 0.020445}
  ],
  "meta": {"model": "ResNet-50", "top_k": 5, "filename": "test_image.jpg"}
}
The first attempt failed — multiline \ syntax breaks in Git Bash on Windows. Compressed it to a single line and it ran clean. ResNet-50 processed test_image.jpg and returned five ranked predictions with confidence scores.
Prometheus is scraping. The metrics are flowing.
I verified the /metrics endpoint directly through Swagger — GET /metrics returned a 200 with the full Prometheus text payload:
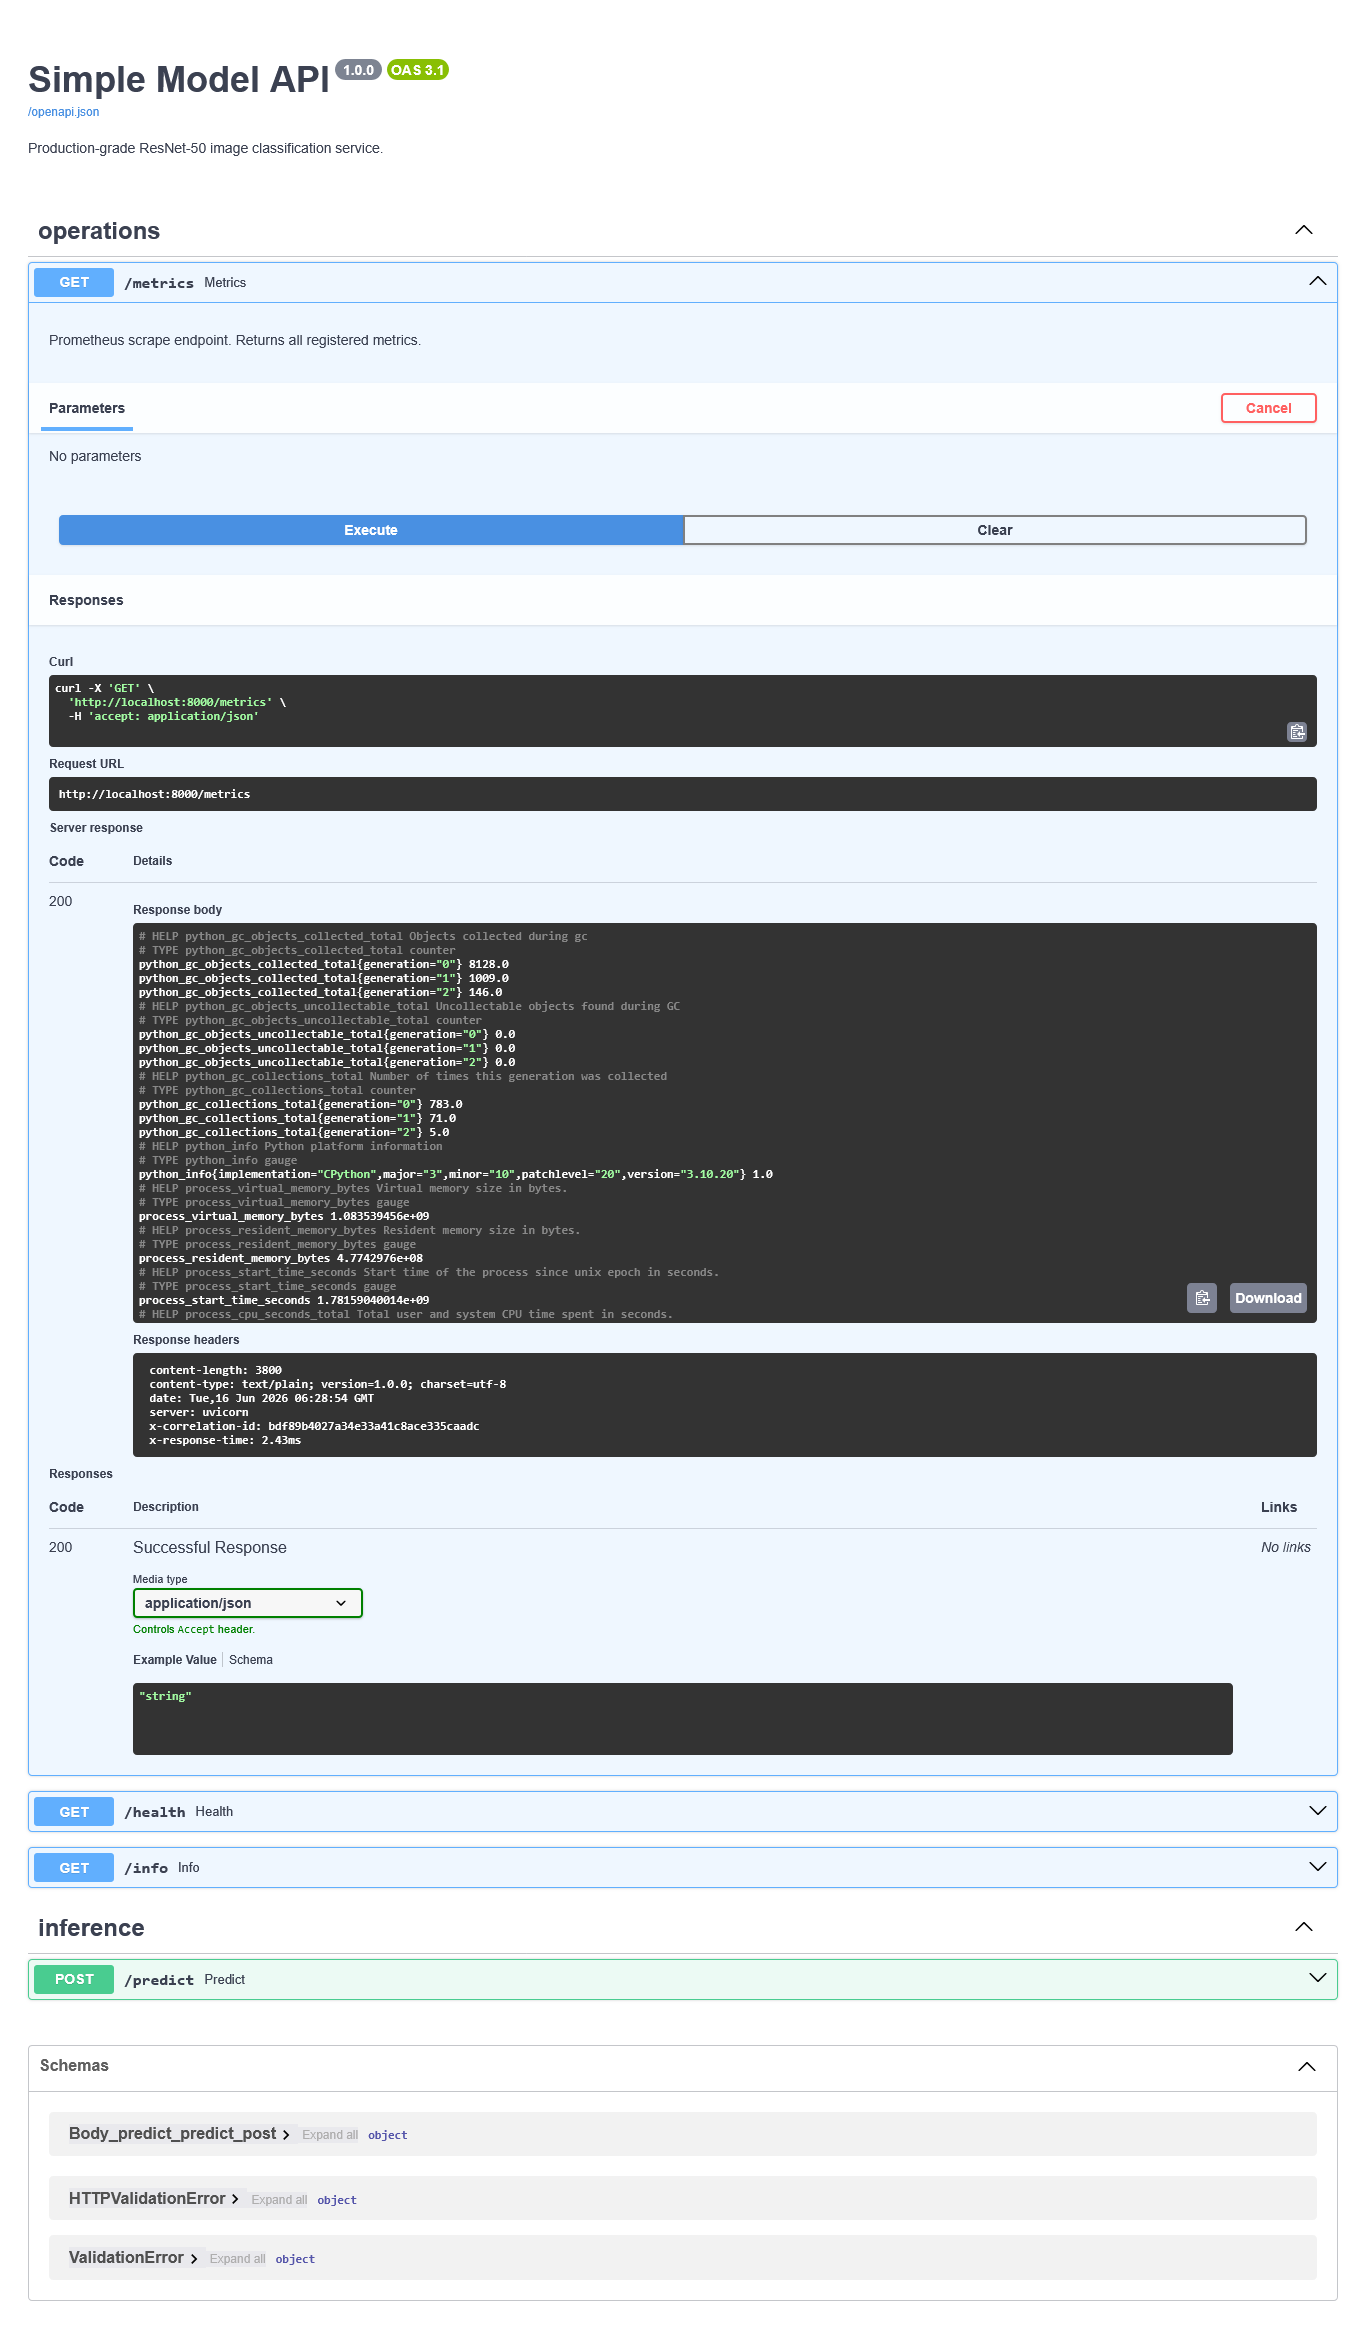
Fig 1: /metrics returning 200. Python GC counters, process memory, and CPU time all present.
Then I queried http_requests_total in Grafana Explore with Range mode. The default Instant mode only returns a table snapshot — switching to Range unlocked the time-series plot.
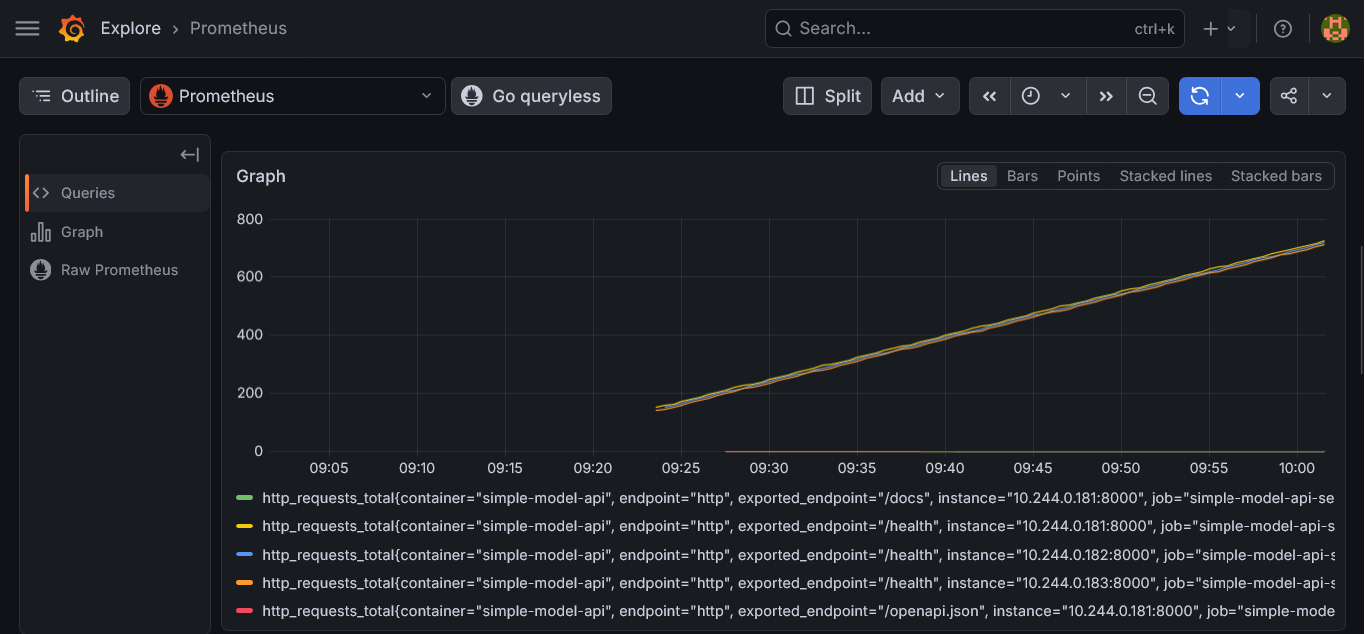
Fig 2: http_requests_total climbing across 10.244.0.181, 10.244.0.182, and 10.244.0.183. Three pods, three lines, live traffic confirmed.
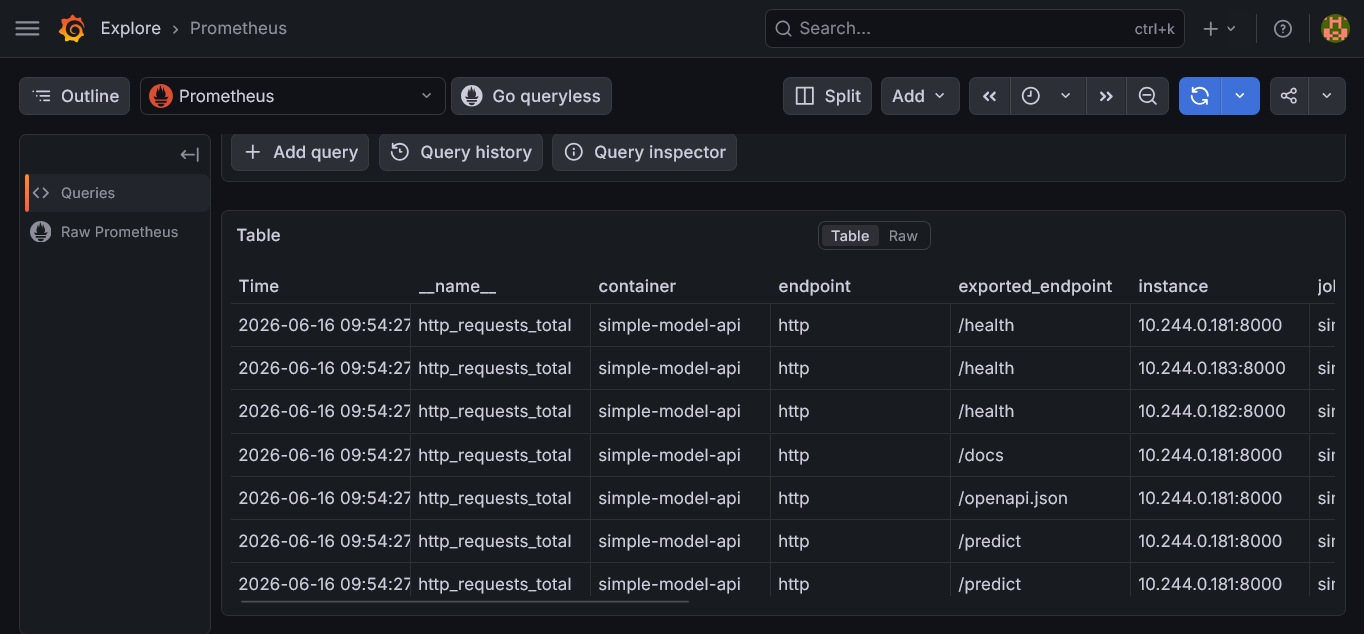
Fig 3: Table view — /health, /docs, /openapi.json, and /predict all recording hits across pod instances.
I ran the inference latency query next:
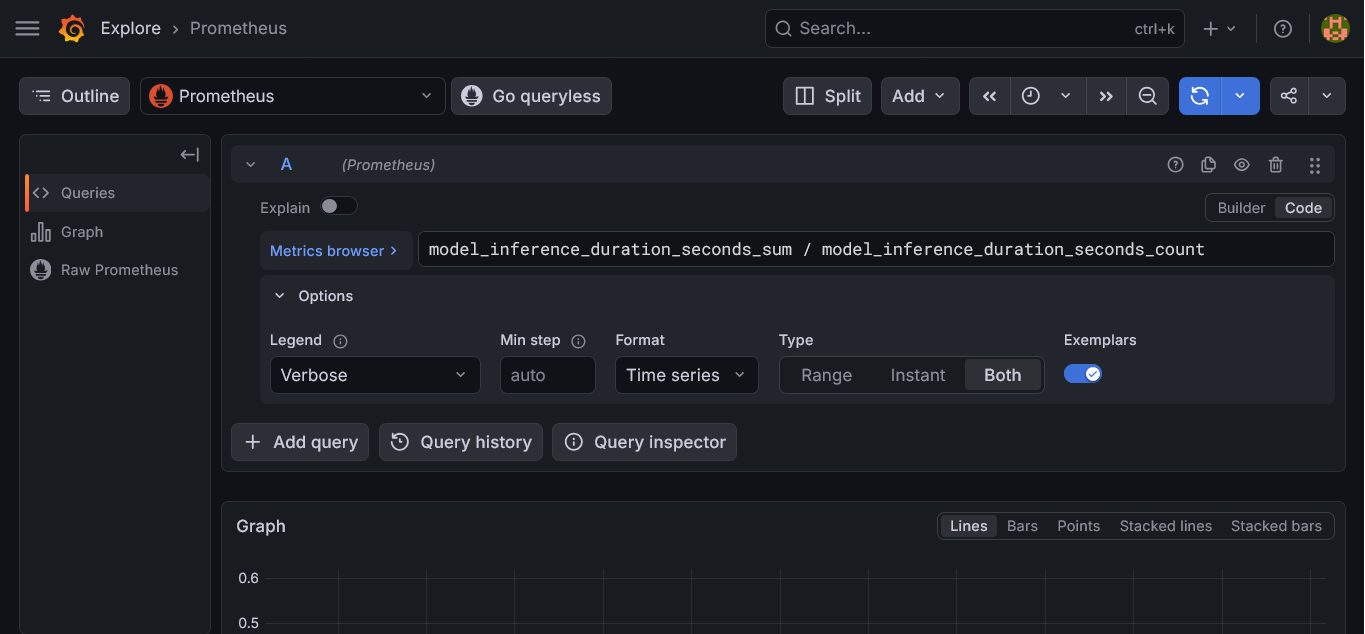
Fig 4: model_inference_duration_seconds_sum / model_inference_duration_seconds_count — average inference time per request.
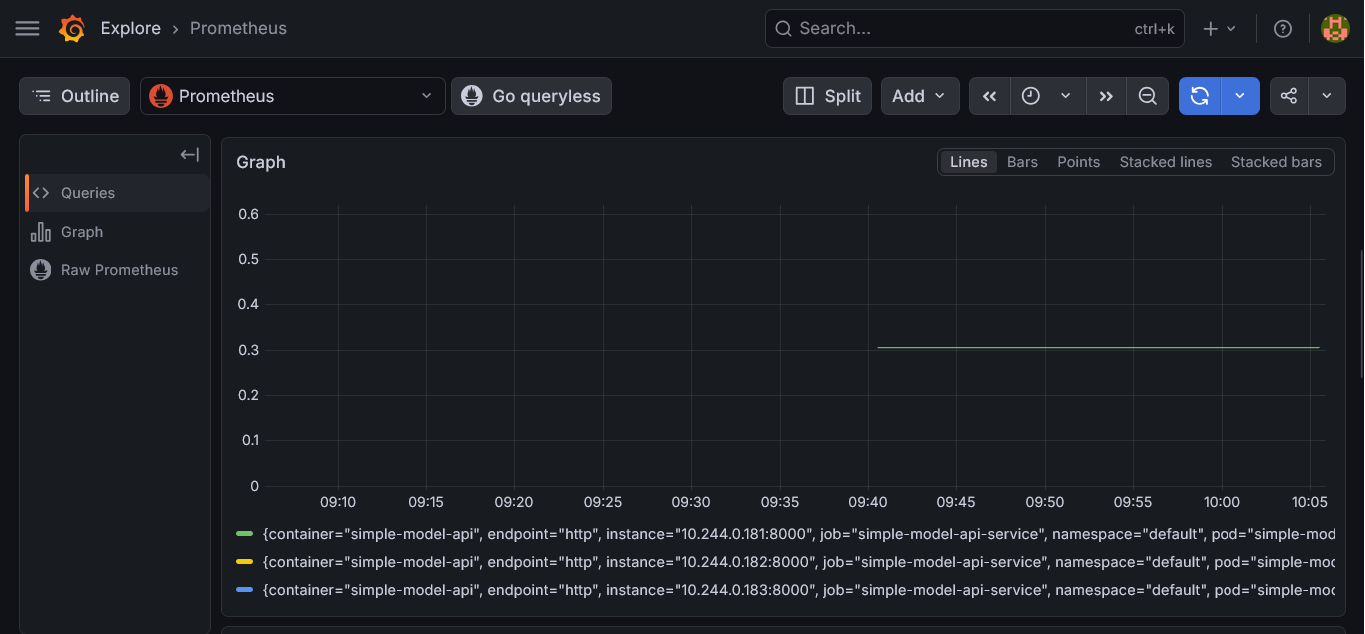
Fig 5: Latency reading at ~0.3 seconds on one pod. The other two pods show no inference traffic yet — the predict request hit a single instance.
The /metrics endpoint confirmed the scrape is working:
$ curl http://127.0.0.1:8000/metrics
http_requests_total{endpoint="/health",method="GET",status_code="200"} 276.0
http_requests_total{endpoint="/docs",method="GET",status_code="200"} 1.0
http_requests_total{endpoint="/openapi.json",method="GET",status_code="200"} 1.0
model_inference_duration_seconds_count 0.0
The h2bjw thread — still open
The pod is gone. The new ReplicaSet replaced it. All three new pods came up in 23 seconds each. That is not a diagnosis. The pod name was random. Whatever caused the 97-second gap and the latency variance in 011 and 012 could land on any new pod under the right conditions. I do not know yet if the CPU bump fixed it or just cleared the symptom this time.
Where this sits
| Item | Status |
|---|---|
cAdvisor TLS bypass — values.yaml | Done |
Helm upgrade — 4 attempts, landed with --no-hooks | Done |
CPU request bumped 250m → 500m | Done |
CPU limit bumped 1000m → 2000m | Done |
| Namespace quota conflict blocking rollout | Found and deleted |
New pods — all 3 at 1/1 in 23 seconds | Done |
/predict returning live inference results | Confirmed |
| Prometheus scraping all three pod IPs | Confirmed |
| Grafana utilisation panels — “No data” | Needs verification next session |
| Pod startup lag — cause not yet diagnosed | Open — watching new ReplicaSet |
The quota I created to protect the cluster in 012 was the thing that blocked the fix in 014. That is the kind of thing that only shows up when you run it.